What to measure after you put an AI agent in front of customers
Conversation count is a vanity metric. These are the numbers that tell you whether the agent is helping, hiding problems, or quietly making things worse.
Two weeks after launch, someone will send around a screenshot: 1,847 conversations this month. It is the least informative number the system produces. It tells you the widget is visible, which you already knew.
The useful measurements answer three questions: did the customer get what they came for, did the agent stay honest, and did the business gain anything. Here is a small set that covers all three without a data project.
The four that matter most
Resolution rate. The share of conversations that ended with the customer’s need met and no human involved. Note what this is not: it is not “conversations without a handover”, because a customer who gives up and leaves also didn’t trigger a handover. Measure it by outcome, not by absence of escalation: a confirmed booking, a completed lookup, an explicit “thanks, that’s what I needed”, or a follow-up signal like not opening a support ticket within 48 hours.
Escalation rate, split by reason. The headline number is nearly useless; the breakdown is where the product lives. Escalations because the agent lacked knowledge point at your index. Escalations because the customer asked for a person immediately point at trust or placement. Escalations on refunds and billing are usually correct behaviour and should not be optimized away. A falling escalation rate is only good news if the resolution rate rises with it.
Grounded-answer rate. The share of answers that cited at least one retrieved source. This is your hallucination early-warning system. When it drops, the agent has started answering from general knowledge instead of from your content. Usually because a sync broke or someone loosened an instruction. Watch the trend, not the absolute value.
Outcome per 100 conversations. Bookings, qualified leads, orders assisted — whatever your agent is actually for. Normalizing by conversation volume is what makes the number comparable across a slow August and a busy November.
The supporting cast
These are worth a monthly look rather than a dashboard tile:
- Time to first useful answer. Not response latency. The number of turns before the customer got something they could act on. Three turns of clarifying questions is a design problem.
- Conversation depth distribution. A healthy agent has a fat tail of one-to-three-turn conversations (quick answers) and a smaller cluster of eight-plus (real work). A big middle bump often means the agent is almost answering and the customer keeps rephrasing.
- Repeat-question rate. The same customer asking the same thing twice in a week means the answer was technically correct and practically useless.
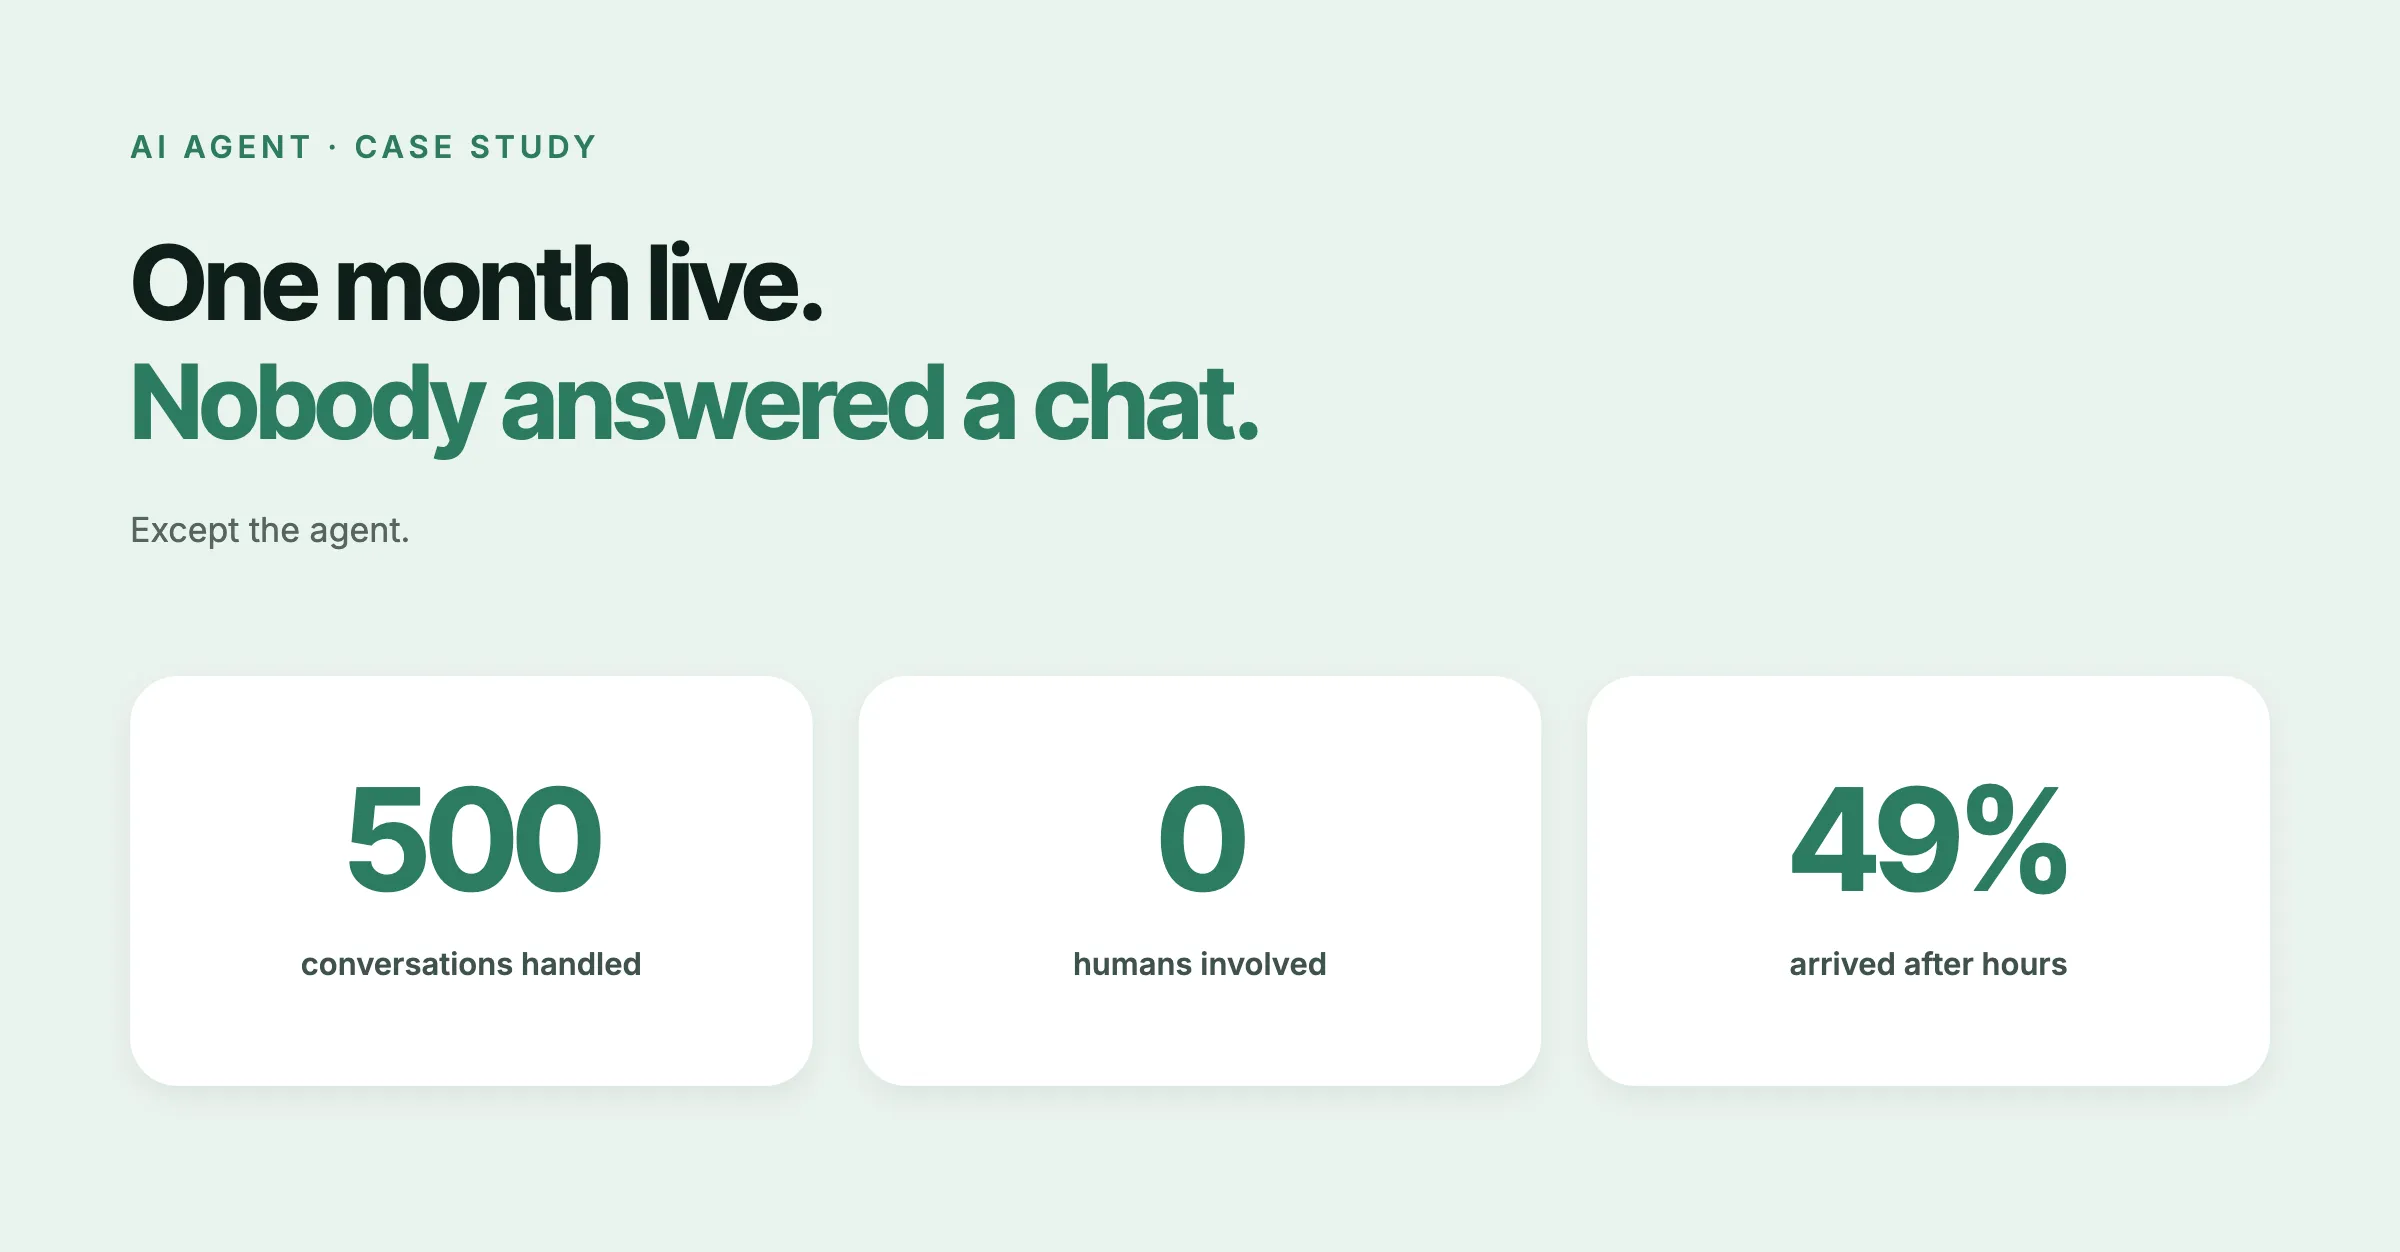
- After-hours share. Frequently the clearest evidence of value: the conversations that would simply not have happened otherwise.
- Cost per resolved conversation. Model and platform cost divided by resolutions, not by conversations. It is the only cost number that can be compared to anything, and it behaves very differently depending on whether your vendor charges a flat monthly fee or per conversation.
Two traps
Optimizing containment. Containment — keeping conversations away from humans — is trivially maximized by making the handover hard to find. Every organization that has chased this number has produced the same result: a support channel customers stop using and a satisfaction score nobody wants to present. Measure resolution; let containment be a consequence.
Averaging satisfaction. A 4.2 average hides the shape of the distribution, and the shape is the whole story. Ten one-star conversations with a common cause are a specific, fixable bug. Read those ten. The average will move on its own afterwards.
What good looks like, roughly
Numbers vary enormously by industry, traffic mix and how much the agent is allowed to do, so treat these as orientation, not targets:
| Signal | Reasonable early expectation | Investigate when |
|---|---|---|
| Resolution rate | Rising month over month | It rises while satisfaction falls |
| Escalation rate | Stable, with a clear reason mix | Any single reason dominates |
| Grounded-answer rate | Consistently high, flat | It drops without a content change |
| Outcome per 100 | Improving as knowledge grows | It moves with traffic, not quality |
The direction matters more than the level. An agent whose resolution rate climbs steadily for three months while grounding stays flat is working. One with an excellent resolution rate that has not moved since launch has probably stopped learning from its own transcripts. Which is usually a sign that nobody is reading them.
The measurement that isn’t a number
Once a week, read twenty conversations end to end. Ten random, ten from the lowest-rated. Nothing in an analytics view has ever surfaced what an actual transcript surfaces: the sentence where the customer got confused, the policy that reads clearly to you and ambiguously to everyone else, the moment the agent was almost helpful.
Dashboards tell you that something changed. Transcripts tell you why. Budget time for both, and be suspicious of any report that contains only the first.